
Since the beginning of the 21st century, Europe has experienced a series of extremely hot and dry summers (2003, 2010, 2013, 2015 and 2018). These events not only sparked scientific discussion whether these events are the most extreme droughts in recorded history, but also started to draw the attention of the media and public to this phenomenon.
Drought takes a long period of time to evolve and when it does, it might show it's effects in various parts of the hydrological cycle. For example, meteorological drought, which is a lack of atmospheric precipitation (rainfall and/or snowfall), might result in hydrological drought (low discharge/lake levels), agricultural drought (low soil moisture), or both. Thus, it is important to record past occurrences of individual droughts to better understand under what conditions they occured. To address this, a team of scientists from the Czech University of Life Sciences Prague and the Helmholtz Centre for Environmental Research produced a 250-year long European drought inventory. Using the results of hydrologic simulation, the inventory presents the severity and spatial extent of meteorological, hydrological, and agricultural drought in a single, comprehensive framework.
The study, led by our PhD student V. Moravec, was published in Geophysical Research Letters. In general, the researchers found that there is a good correspondence between the runoff, soil moisture, and precipitation drought in both Central Europe and the Mediterranean. This fact suggests that the main driver of droughts is lack of precipitation. However, there are also some droughts that happened when precipitation was normal, such as the severe drought of 1953–1954. This could be related to the timing or strength of precipitation throughout the year. Finally, the researchers found two most distinct patterns of change. These are increases in the severity of agricultural droughts over the Mediterranean and the reduced spatial extent of runoff droughts in central Europe.
With the drought inventory, we now have a clear picture of the major drought events in Europe. Future research will help us understand how much alarming is the recent series of dry summers that hit Czech Republic and central Europe in general and improve the efficiency of our water resource management under climate change.
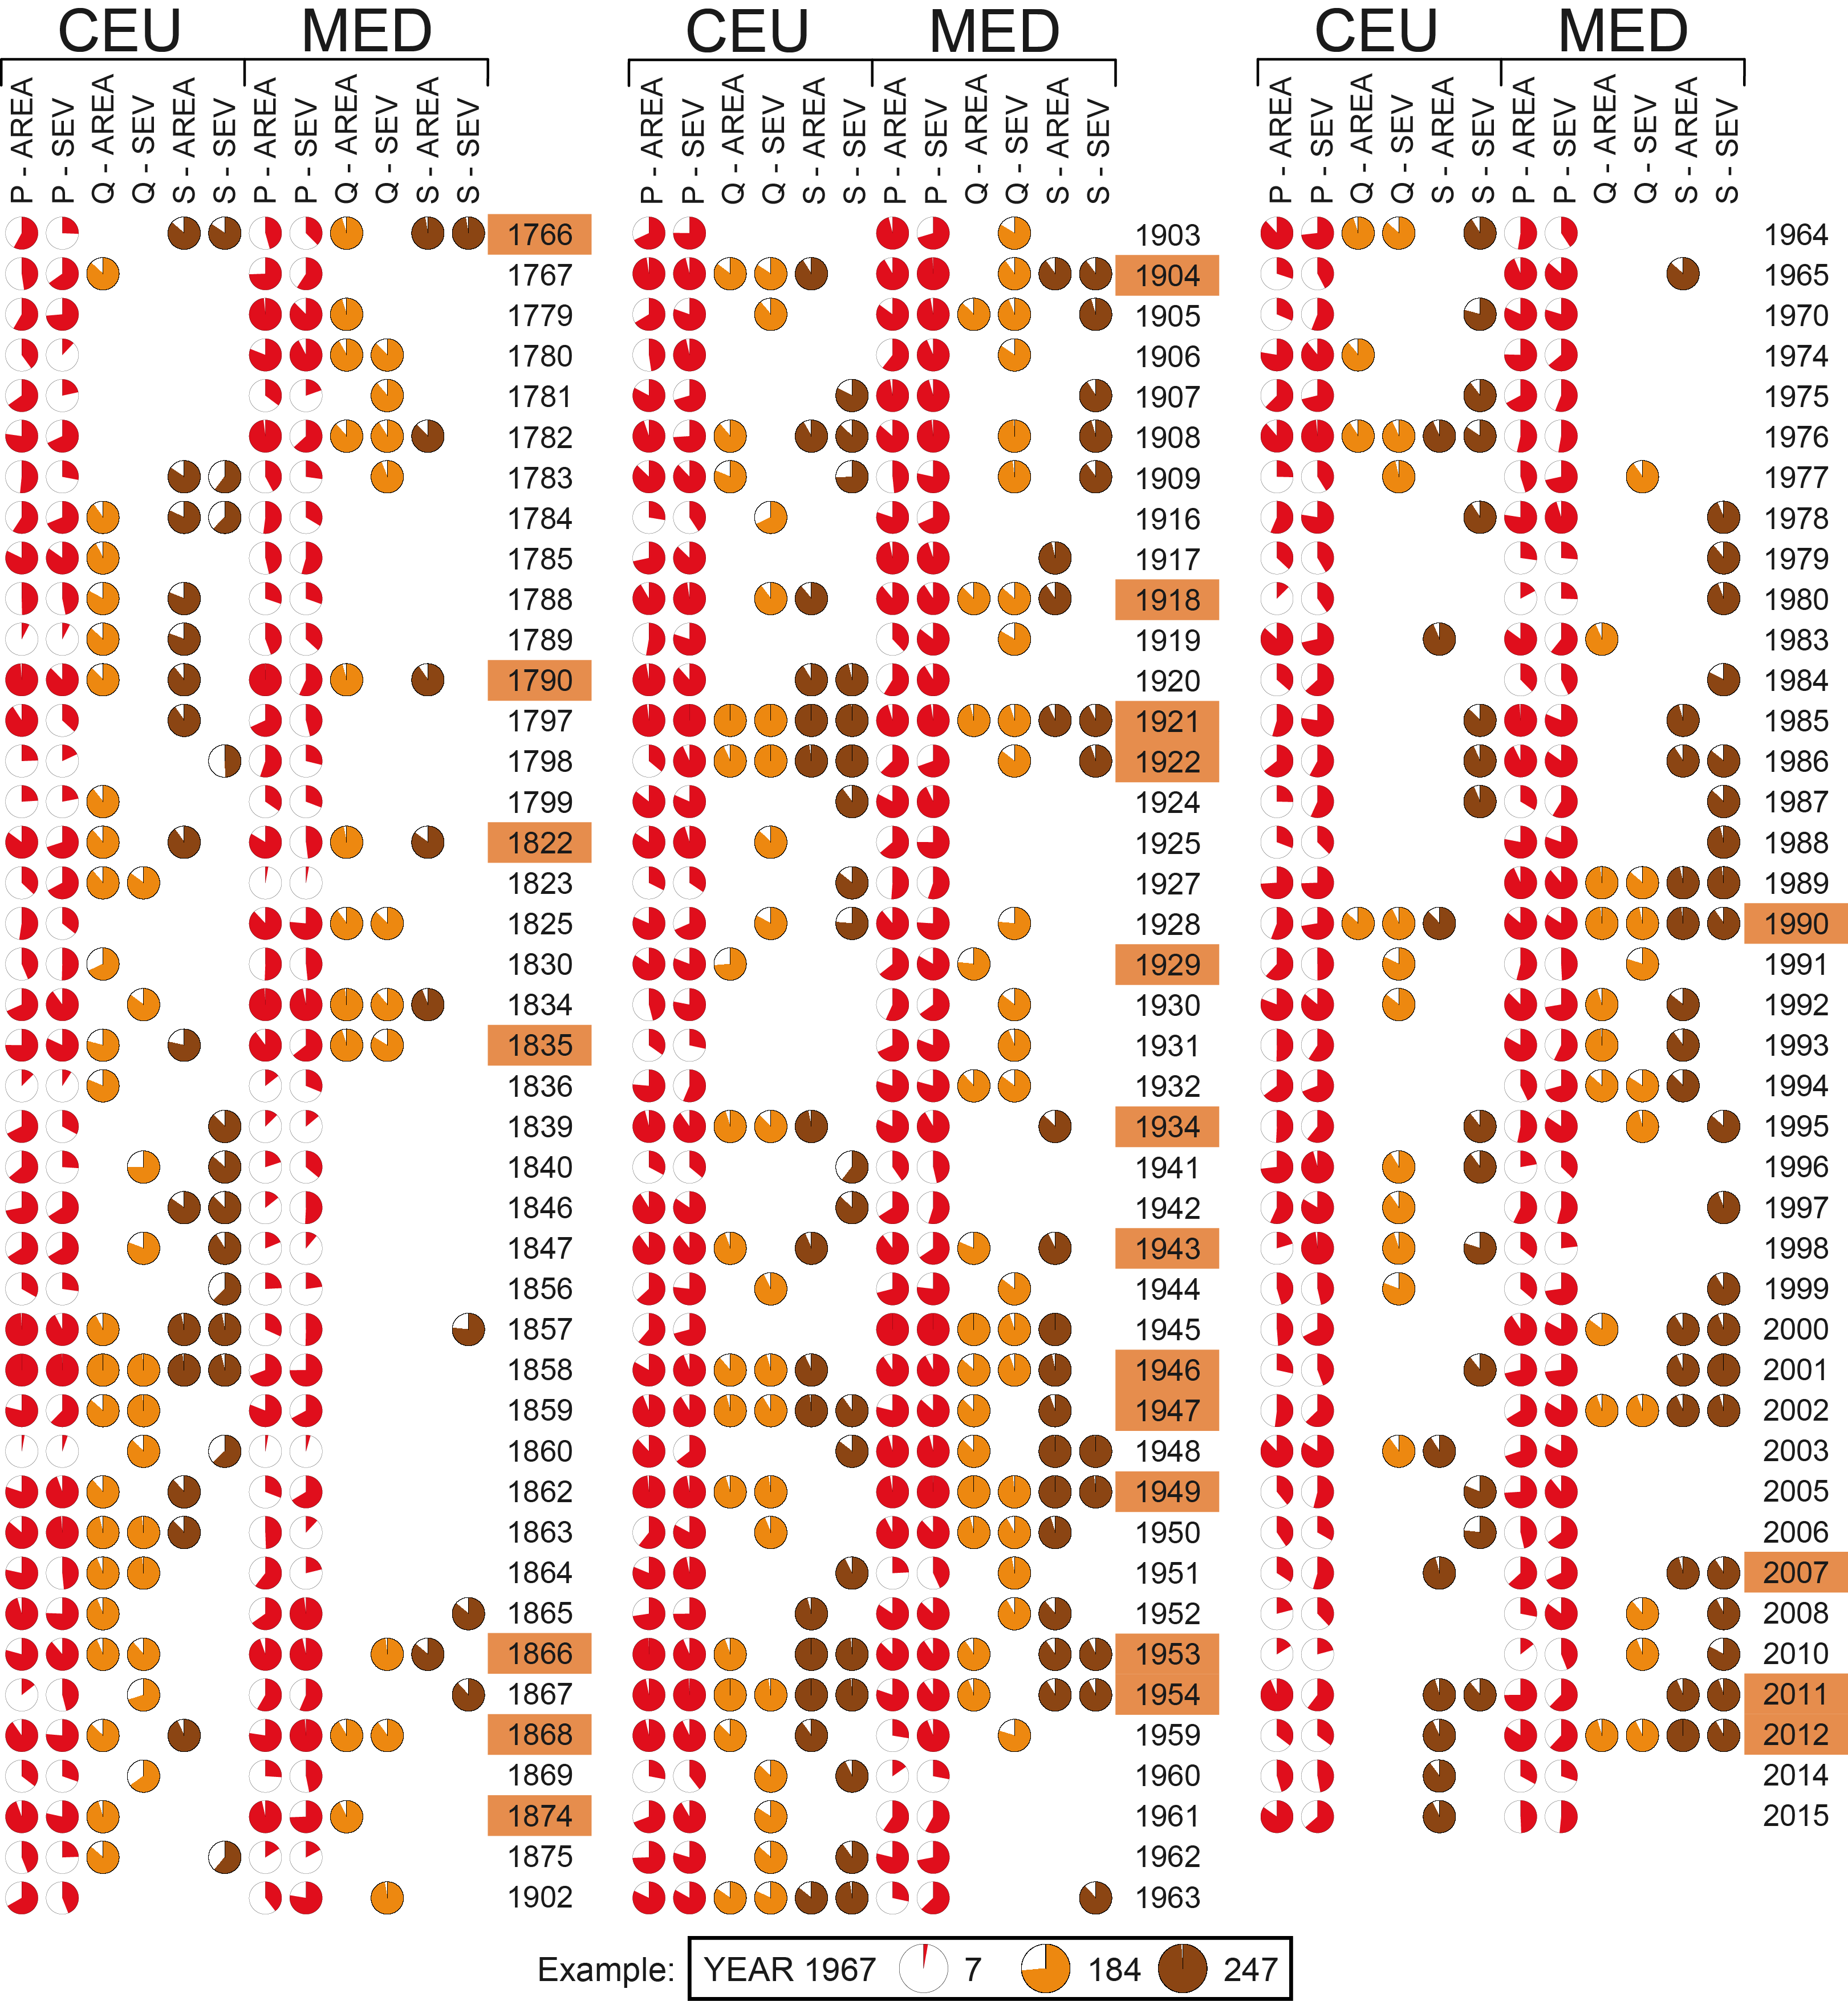
Fig: Mean drought rank derived from all ensemble member ranks given by year, variable (precipitation (P), runoff (Q), soil moisture (S)), characteristic of drought (area, severity) and region (CEU, MED). Red pie charts represent precipitation drought rank, orange pie charts represent runoff drought rank, and brown pie charts represent soil moisture drought rank. Only drought years following our methodology (see section 2) are presented, that is, runoff and soil moisture pie charts are presented when at least 10 ensemble members exhibit a drought area (or severity) rank above the 90th quantile. No runoff/soil moisture pie chart means that the variable in given year did not reach mentioned threshold. Precipitation pie charts are presented for all drought years no matter the threshold. Labels of the years highlighted with orange color can be considered as pan-European droughts (at least one variable in a given year shares the property of being a spatially extended drought). CEU = Central Europe; MED = Mediterranean.